Market Research and Validation
The number of digital TV users and households have been increasing globally over the last 5 years, as can be seen in Figure 1.
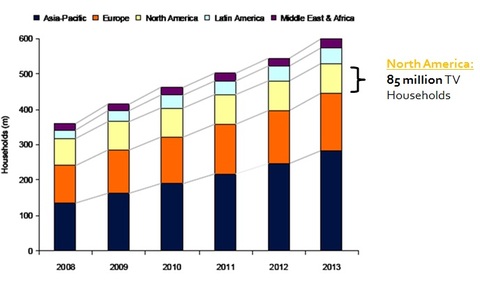
Figure 1: Digital TV Households by Region
With over 600 million users estimated for 2013, we can conclude that the market for this product is very large. There are 85 million users in North-America alone. Of these, we have the following breakdown:
-33 million digital cable TV households
-18 million digital satellite TV households
-17 million digital antenna TV households
Thus, there are 51 million digital TV users that pay monthly subscription fees for their television viewing. These are the main users which we would like to target.
In doing cost comparisons of paying for cable or satellite TV versus ordering an antenna that provides television for free, we find that over 5 years, the Roger's customer who pays for their cheapest package for cable will save about $3,000 (refer to Figure 2). This is a significant money, especially in times of economic difficulty.
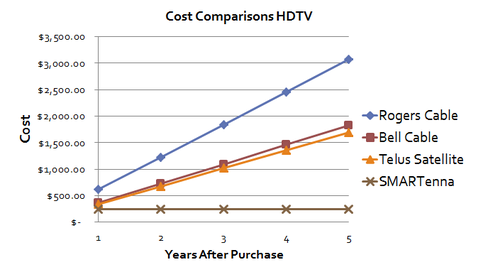
Figure 2: Cost comparisons of HDTV in Toronto, Canada
Figure 2 shows how much Canadians could be saving for their television viewing habits and this is the biggest differentiation strategy we have. Finally, current antenna users frustrated with having to continuously adjust and monitor their antenna direction will find our easy-to-use product worthwhile with its intelligent signal-following control system.
Consumers are often misled to believe that antenna service will not offer enough channels to satisfy their viewing habits. However, Figure 3 shows all of the networks available for a user in Toronto. Clearly there are enough channels being offered for the average television viewer.
Consumers are often misled to believe that antenna service will not offer enough channels to satisfy their viewing habits. However, Figure 3 shows all of the networks available for a user in Toronto. Clearly there are enough channels being offered for the average television viewer.

Figure 3: Channels Received with HD Antenna in Toronto
The Excel spreadsheets used to calculate cost comparisons and revenue projections can be downloaded below.
| prices.xlsx |
We developed the Five Forces Model of the Antenna Industry as well as the SWOT Analysis for the industry with our specific engineering team is shown in the embedded document below.